For the controls and step-by-step instructions, follow carve a lake from a depth chart. This guide explains what the system calculates, why manual review is required, and where we want to improve it.
From printed lines to a lake floor
- Prepare editable paths from native PDF lines or image pixels.
- Check every included path, enter its printed value, and identify the shoreline.
- Align the chart to geographic coordinates using known points.
- Calculate depths between the reviewed contours inside the source shoreline.
- Review the basin, apply it to terrain, and inspect the project's final cut layers.
The uploaded picture stays in your browser. A kept chart stores derived contours, geographic placement, and a calculated depth grid, together with source and review information. It does not preserve the original picture.
Extracting a line is different from understanding it
A vector PDF can contain actual drawn paths. Selecting their line styles avoids losing those paths when the page is turned into pixels. It still cannot tell us whether a path is a contour, a road, the shoreline, or a sample in the legend. A scanned PDF contains a picture instead, so it needs the same image tracing as a PNG or JPEG.
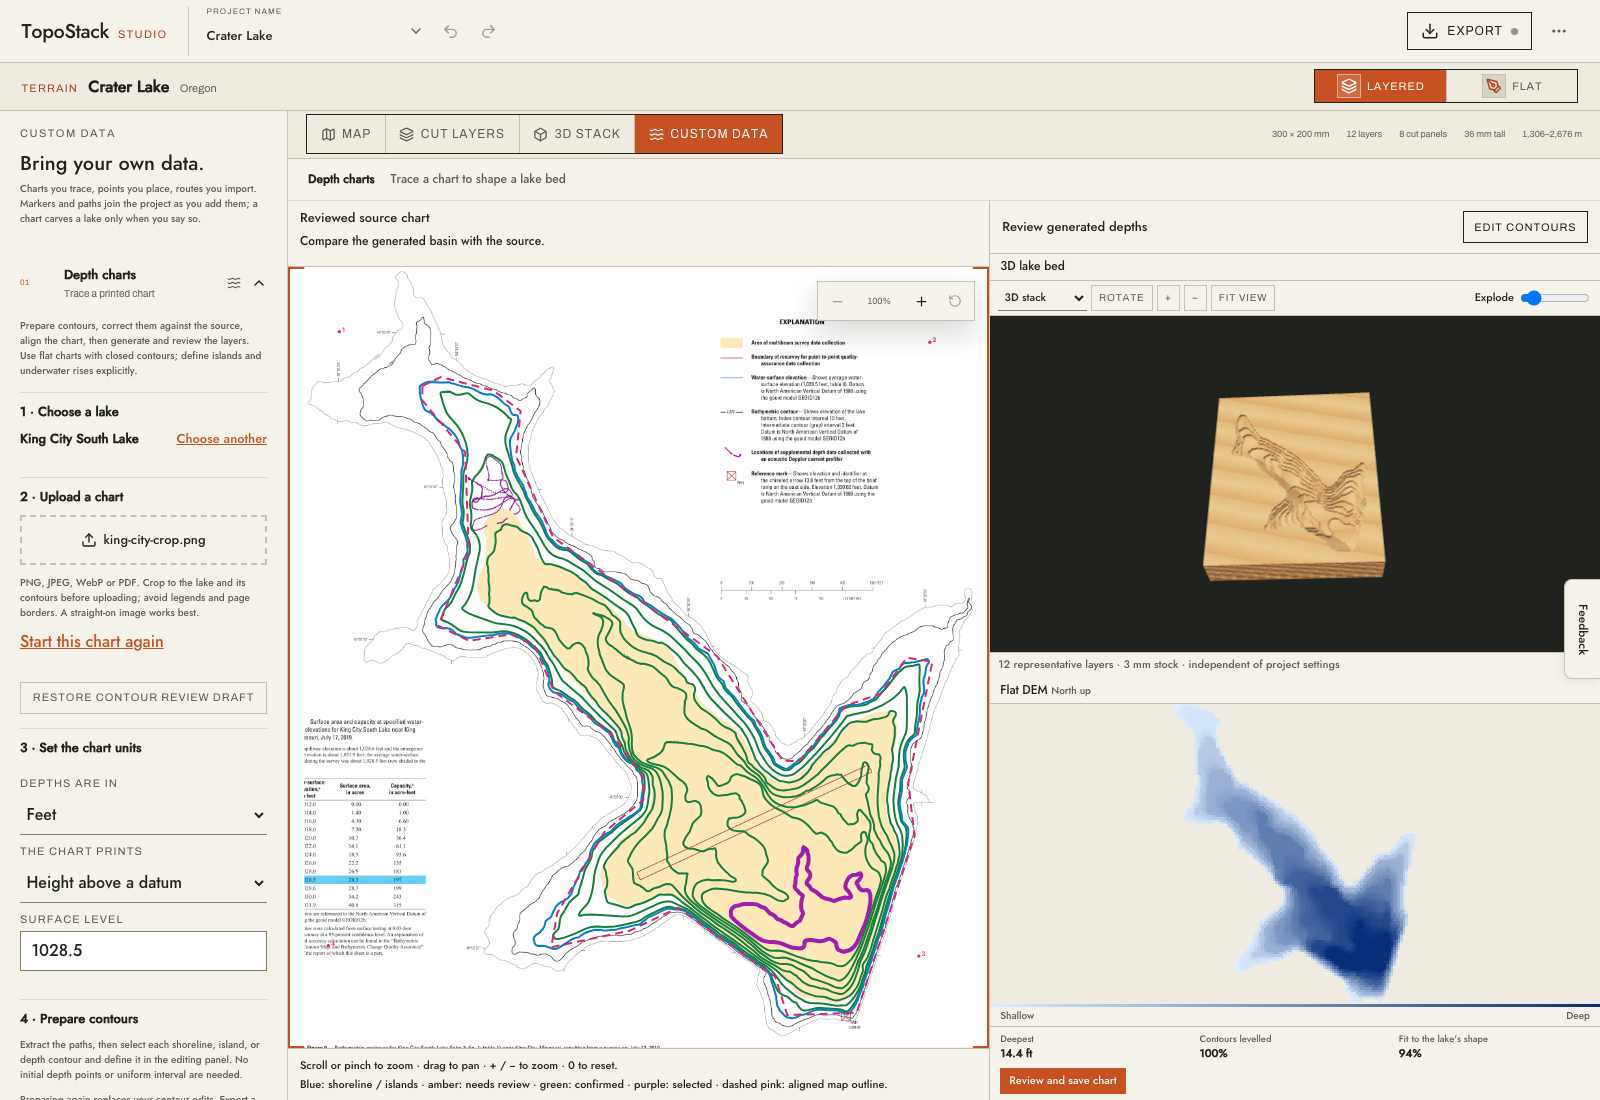
Image tracing follows ink. Printed labels can break a contour; nearby text or a border can accidentally connect to one. A path that looks plausible at small scale may enclose the wrong part of the lake. Values are entered and confirmed by the maker, not automatically read from the chart.
That is why preparation stops at editable proposals. You can remove stray marks, reconnect genuine gaps, redraw missed paths, and correct printed values before any depths are generated. The app rejects open or crossing contours and requires confirmation of every included path.
Why the first version supports a narrower set of charts
The current workflow supports flat charts of one lake, with a complete outer shoreline, explicit island boundaries, and closed depth contours. Each contour has its own printed value and a deeper or shallower interior. Validation checks immediate containment, so underwater rises and separate basins are supported. Crossing or touching networks, contours inside island land, incomplete charts, and perspective photographs remain unsupported.
These restrictions reduce ambiguous interpretations. For example, a loop can describe either a deeper basin or a shallower underwater hill. Closing a broken line in the wrong direction can create a different basin. Supporting those cases well needs richer relationships between contours and better ways to review them.
The compromise is more manual work and fewer supported charts in return for a result whose paths and values you can inspect. Passing the checks still cannot detect every missing contour or incorrect printed value.
Placing the chart needs geographic evidence
A shoreline shape alone can be ambiguous: a nearly oval lake may fit when turned end to end. The reviewed workflow instead asks for at least four distributed positions whose longitude and latitude are known. An affine fit translates, rotates, scales, and shears the source into map coordinates. It does not correct camera perspective or arbitrary distortion in an old scan.
The dashed map outline makes the placement visible over the source. The app checks control-point spread, coordinate residuals, and shoreline overlap. Current guards allow at most 20 m of error at any entered control and require at least 80% intersection-over-union between the shorelines. These are rejection thresholds, not an accuracy promise or a tolerance for cutting.
Several points derived from the same mistaken coordinate interpretation can agree perfectly with one another. Verify the coordinate system and lake orientation against the source. A small residual says the entered points fit together, not that they are correct.
The space between contours is calculated
A contour fixes depth along a line, not at every point of the lake. Elevation labels first become depths by subtracting the floor elevation from the chart's stated water-surface elevation. Units are converted consistently; for example, a floor at 1,020 ft under a 1,028.5 ft surface is 8.5 ft deep.
The default interpolator holds the reviewed contours at their assigned depths and the source shoreline at zero, then solves for a smooth surface between them. This avoids the flat terraces that can arise from simply connecting equal-depth contour vertices with triangles. Smoothness is an assumption about the unsampled space, not additional survey evidence.
The innermost contour does not measure the deepest point. Reviewed generation now holds its depth unless you explicitly supply an interior bottom or summit value. An explicit value shapes a smooth interior without claiming the exact position of the extreme. Earlier generation assumed half an interval beyond the last line; removing that hidden assumption can produce flatter bottoms. This is a deliberate compromise when the chart supplies no further evidence. Island interiors are excluded from the water grid and subtracted from the terrain water polygons, preventing fallback depths from carving them away.
Images are limited to 2,400 pixels on the long side, paths are simplified, and the working depth grid has finite resolution. Stored depth samples use 0.1 m increments. Narrow channels and tiny features may be softened or lost; more decimal places in the controls cannot restore detail absent from the source.
A good floor still needs a fabrication review
The chart preview shows representative layers so you can compare basin appearance before applying the chart. The finished project's crop, vertical scale, depth exaggeration, material thickness, and feature-size settings determine the actual cut layers. A shallow shelf may occupy no separate sheet, and small changes in depth can move an edge onto a neighboring layer.
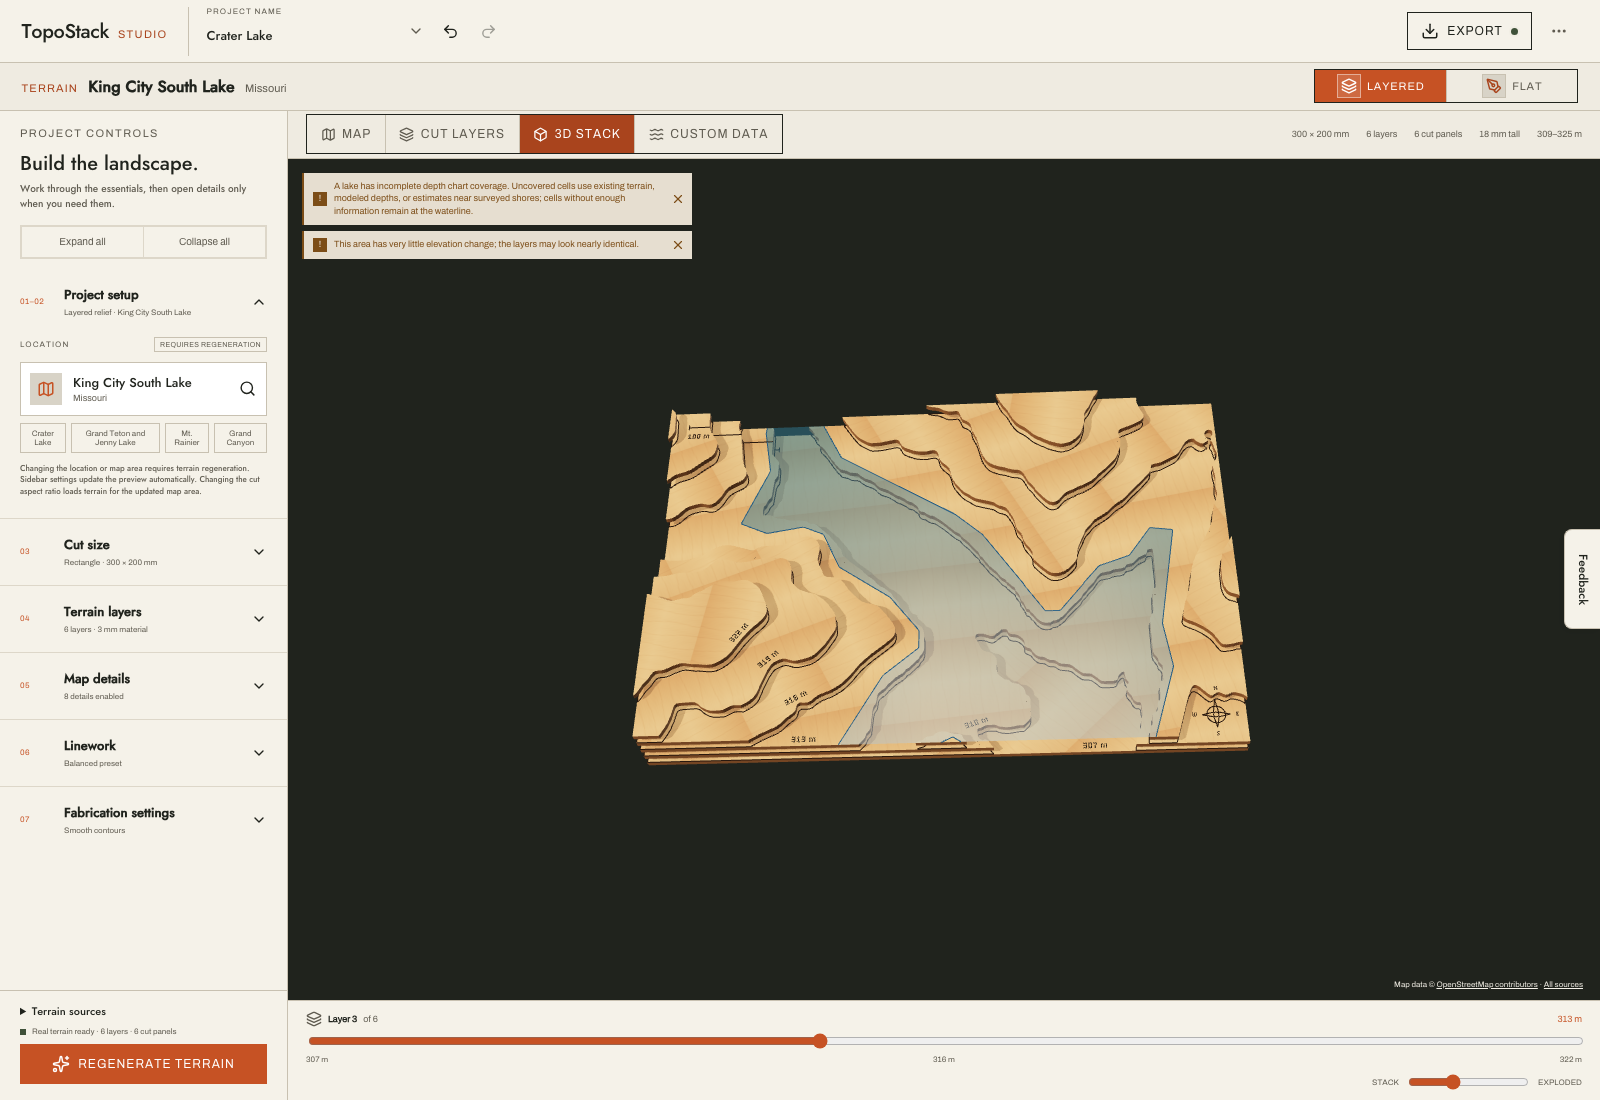
Uncovered cells use existing terrain, modeled depths, or estimates near surveyed shores where possible; cells without enough information remain at the waterline. These fallback areas may have a different level of evidence from the reviewed chart interior.
Saving requires a separate confirmation that you inspected the basin and layers. That review status travels with the chart in a project file. It records workflow completion, not a survey certificate or proof that the pieces will cut and assemble cleanly.
What our real-chart checks establish
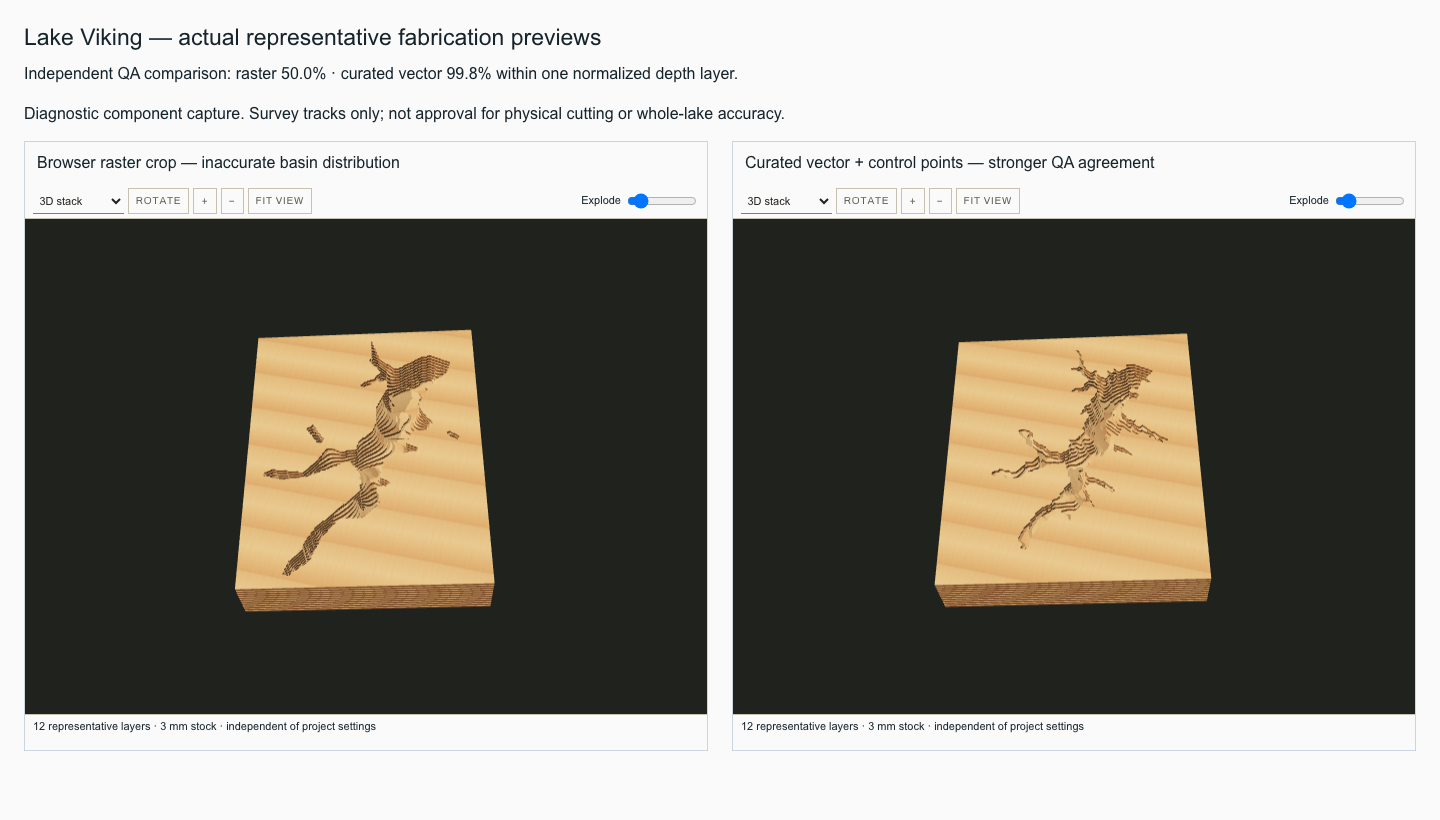
In the earlier King City South benchmark (using the original half-interval interior assumption), eight underwater contours produced a 5 m grid without inferred contour labels. Comparison with 25,782 independent QA soundings gave a median absolute depth error of 0.120 m and a 95th-percentile error of 0.291 m, weighting each occupied 20 m cell equally.
Those many soundings occupy only 21 cells, so they do not validate the whole lake or its shoreline. At a shared representative layer scale, all weighted comparisons were within one sheet; when each result was separately normalized to its own depth range, that fell to 81.4%. The reference normalization used the deepest QA sounding, not a verified whole-lake maximum.
Those historical scores have not been extended to the new island/rise cases or the changed default interior. Automated topology and terrain-mask checks cover those cases separately. This supports one corrected example. It does not establish broad automatic tracing accuracy, final toolpath agreement, or physical cutability. A representative physical cut and assembly remains necessary to validate the fabrication appearance.
Where we want to improve
These are directions for future work, not features available today or a release schedule:
- Better proposals around printed labels and broken lines, with clearer indicators of uncertain connections.
- Easier coordinate calibration and correction, while keeping placement inspectable.
- Support for open contour networks, touching saddle relationships, and geographically positioned bottom or summit soundings. Closed islands and underwater rises are now supported.
- More independent real-chart benchmarks across scan quality, chart styles, and lake shapes.
- Fabrication-focused comparisons of final layer edges, thin bridges, and assembled pieces, beyond depth error alone.
Improving automation should reduce repetitive work while keeping source review available. Until stronger validation supports a broader workflow, the reviewed paths, explicit coordinates, and final layer inspection remain essential.
Sources and related guides
Source charts: public-domain USGS King City South, sheet 2 and Lake Viking, sheet 7. Independent King City checks use the associated USGS survey data release. Screenshots are from TopoStack; map data © OpenStreetMap contributors. The images show software previews, not physically fabricated examples.
Follow the tracing workflow, read how charted, surveyed, and modeled lake floors fit together, or use troubleshooting when a review is blocked.