Choose a chart this version supports
Use a flat, geographically referenced chart of one lake, with a complete shoreline and closed, noncrossing depth contours. Islands and underwater rises are supported when explicitly defined. Incomplete contour networks and photographs distorted by perspective are not supported. A scan, screenshot, or vector PDF is a better starting point.
- PNG, JPEG, WebP or PDF, with readable contours and printed values.
- The units and readable values for every included depth contour. If the numbers are elevations, also the chart's water-surface elevation.
- At least four known geographic positions spread around the chart, with both longitude and latitude in WGS84 decimal degrees.
- The complete outer shoreline and any island boundaries. No seed points or uniform contour interval are required.
Keep coordinate ticks or grid intersections needed for alignment when cropping. A printed tick showing only latitude or longitude is not a complete control point by itself. If the chart uses another coordinate system, convert its coordinates to WGS84 before entering them.
Check the surveyed-depth directory first. Charts are for layered output: flat engraving has no lake floor to carve. Preparing a chart does not require terrain generation or move your project's map area.
1. Choose the lake and upload the source
Open Custom data, then Depth charts. Search for the lake or a nearby town and select the matching result, or click its outline on the map. Small lakes listed as “Lake from the map” can also use a chart.
Upload the picture or PDF and, for a multipage PDF, choose the chart page. Pictures are reduced to 2,400 pixels on their longer side. Leave out unrelated page furniture when possible, but retain the full shoreline and the coordinates needed for alignment. If a PDF renders blank, export its chart page as a picture.
Both the source chart and contour-repair editor use the same zoom controls as the flat and cut-layer views. Scroll over the chart or pinch to zoom around a detail, drag to pan, and use the plus/minus buttons or keys for steps. The reset button or 0 returns to the fitted view. A drag moves the view without placing a depth or editing a path.
2. Set units and prepare contours
Set Depths are in to the printed units. Choose Depth below the surface or Height above a datum; elevations also require Surface level in the same units. Each contour gets its own printed value during review; irregular intervals are supported.
For a vector PDF, expand Use native PDF lines (recommended) and select the line styles containing the shoreline and underwater contours. Leave unrelated styles unchecked. If that control is absent, or the PDF is a scanned picture, use image tracing.
Select Prepare contours for review in the sidebar. This creates editable path proposals directly from the image or selected PDF lines. It does not create a depth grid or approve their accuracy.
3. Review and correct every included path
The chart fills the left side while repair tools replace the previews on the right. Use Contours, Alignment, and Checks to switch tools; scrolling the tools keeps the chart in place. On narrow screens the tools sit below the chart. Compare the colored paths with the source underneath. Select a path on the picture or in the contour chooser. Set its Contour printed value, then use Confirm path and value. Select the actual water boundary and choose Use as shoreline, then confirm it too.
- Use Exclude stray path for text, borders, legend fragments, and above-water contours. Excluding a genuine underwater contour can distort the basin.
- Select an open fragment and choose Join paths, then click or tap the next fragment on the chart. The source stays purple; hovering or focusing a target previews it and the proposed endpoint connection in cyan. Escape or Cancel joining leaves both paths unchanged. A join can be undone with Undo edit. Use Close path for a legitimate remaining gap and check the connection against the printed line before confirming.
- Use Redraw selected path or Draw new contour when the source line was missed. Individual vertices can also be corrected.
- Undo edit and Redo edit belong to this contour editor. A changed path needs confirmation again.
Follow the reported issues to unresolved paths. Included contours must be closed, inside the shoreline, noncrossing, and consistent with their local contour relationships. Do not dismiss a real contour simply to clear a warning.
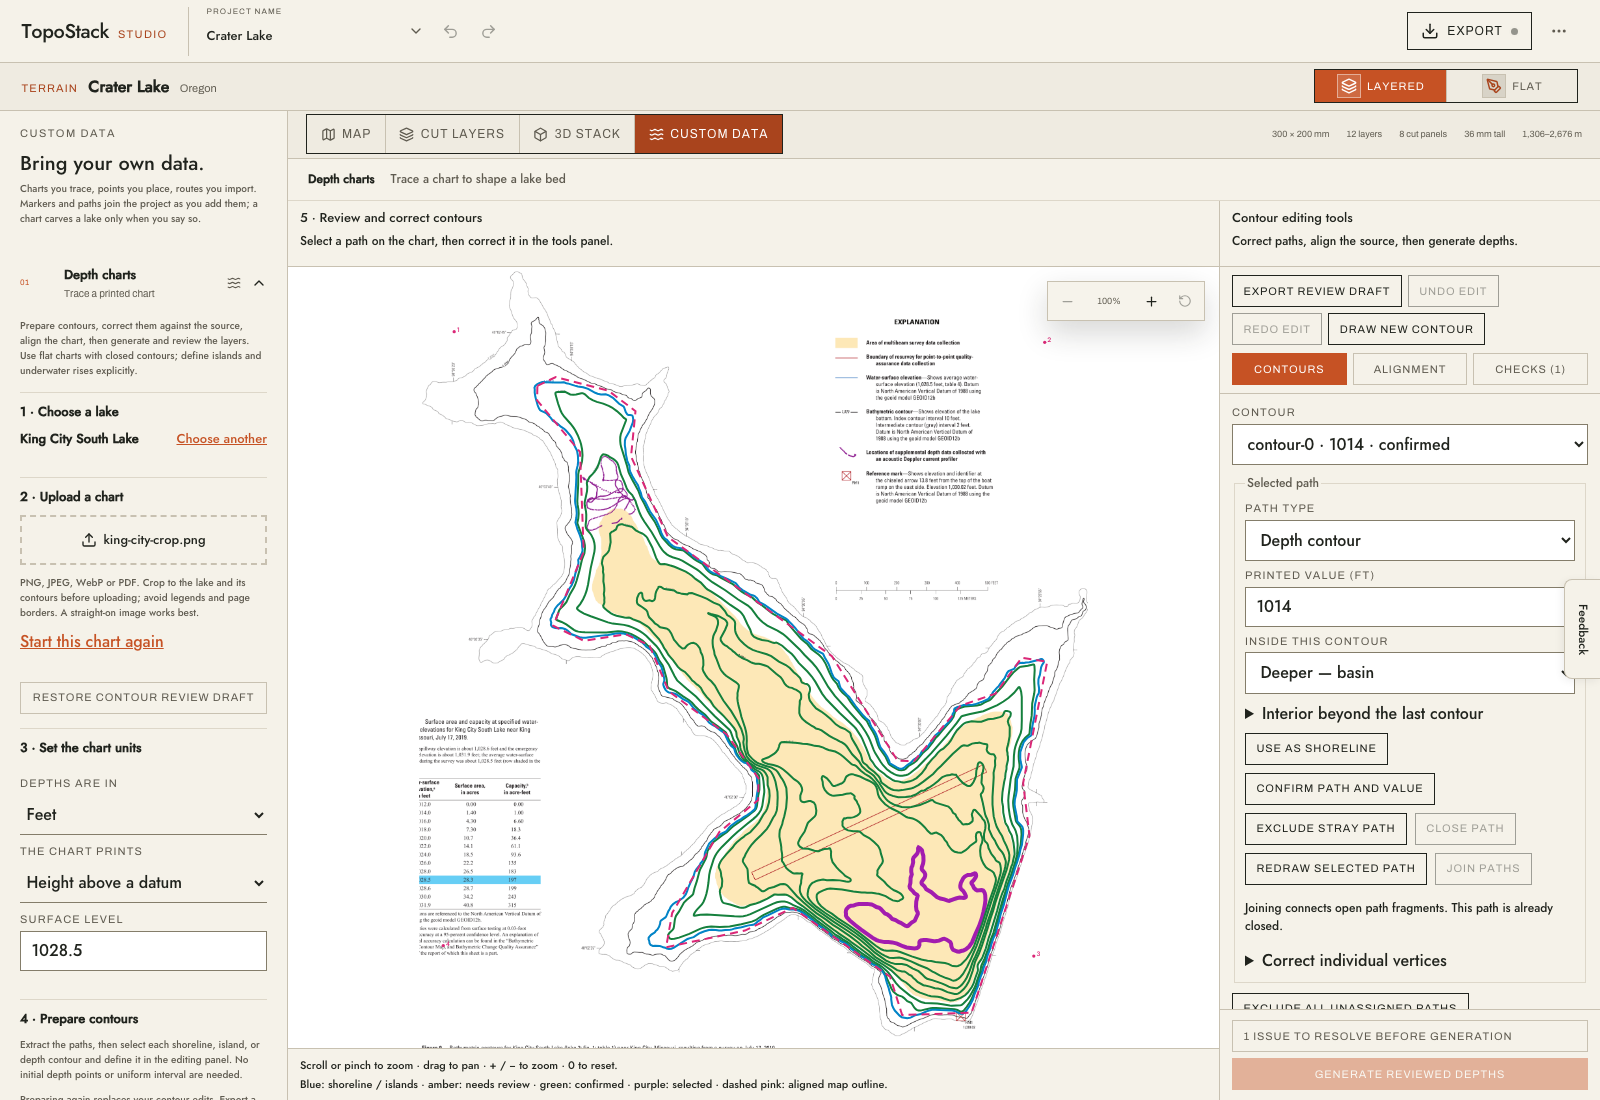
Islands, underwater rises, and basin bottoms
Set the selected path's type to outer shoreline, island boundary, or depth contour. Island boundaries sit at the water surface; their interiors remain land in both the depth grid and terrain carving. Do not assign underwater values to island boundaries. A contour inside island land must be excluded or corrected.
For a depth contour, choose whether its interior is deeper (a basin) or shallower (an underwater rise). A rise needs a surrounding deeper contour. Multiple basins and rises can coexist; the checks compare each contour with its immediate surrounding path instead of requiring every nested line to get deeper.
Beyond an innermost contour, the default is to hold that contour's value. Expand the interior controls to enter a known or deliberately modelled bottom or summit in the same printed units. That value shapes a smooth interior; its exact location is not surveyed. Leave it blank when the source does not justify an extra assumption. Values on non-innermost contours are blocked because enclosed paths already define that region.
Boundaries must remain separate: touching or crossing paths need repair. Narrow channels and small islands still need inspection at the final grid and fabrication scale.
4. Align the chart with known coordinates
Open Alignment in the tools panel. Select Place alignment point, click a known position on the source, then enter its longitude and latitude. Repeat at least four times, spread around the lake rather than clustered in one corner. Use negative longitude west of Greenwich and negative latitude south of the equator.
Check the dashed pink map outline against the blue source shoreline, and verify which end of the lake is north. The app checks coordinate fit and shoreline overlap. If alignment fails, check the points, coordinate system, source crop, and lake selection. A low residual alone does not prove the coordinates are correct.
Once the overlay agrees with the source, check the alignment confirmation. The app will not generate depths until alignment and all contour issues are resolved.
5. Generate depths and inspect their appearance
Select Generate reviewed depths. The right panel switches to the 3D and depth-map previews. Edit contours returns to the repair tools without losing zoom or undo history; View generated depths returns to the current result if you have not changed the chart. Compare the deepest part, shallow shelves, channels, and basin orientation with the chart. Use the representative stack to inspect the stepped shape and the shaded depth view to inspect the continuous floor.
The chart's representative preview is independent of your project settings. Its sheet count and exaggeration do not predict your finished cut layers. Check the actual project's layers after applying the chart, especially where small islands of material or narrow bridges may form.
Changing a contour, its value, or alignment invalidates the generated result and layer approval. Resolve the issues and generate again. Prepare contours again replaces manual edits with new proposals; export a draft first if you want to keep them.
6. Keep, apply, and regenerate
Select Review and save chart. Name the chart, identify its source, and confirm that you checked the generated basin and layers against the original. Only then is Keep this chart available.
Keeping a chart adds it to Your charts. Select Use for beside the lake's name, return to your map, and select Regenerate terrain. Step through Cut layers at the final material thickness and output size.
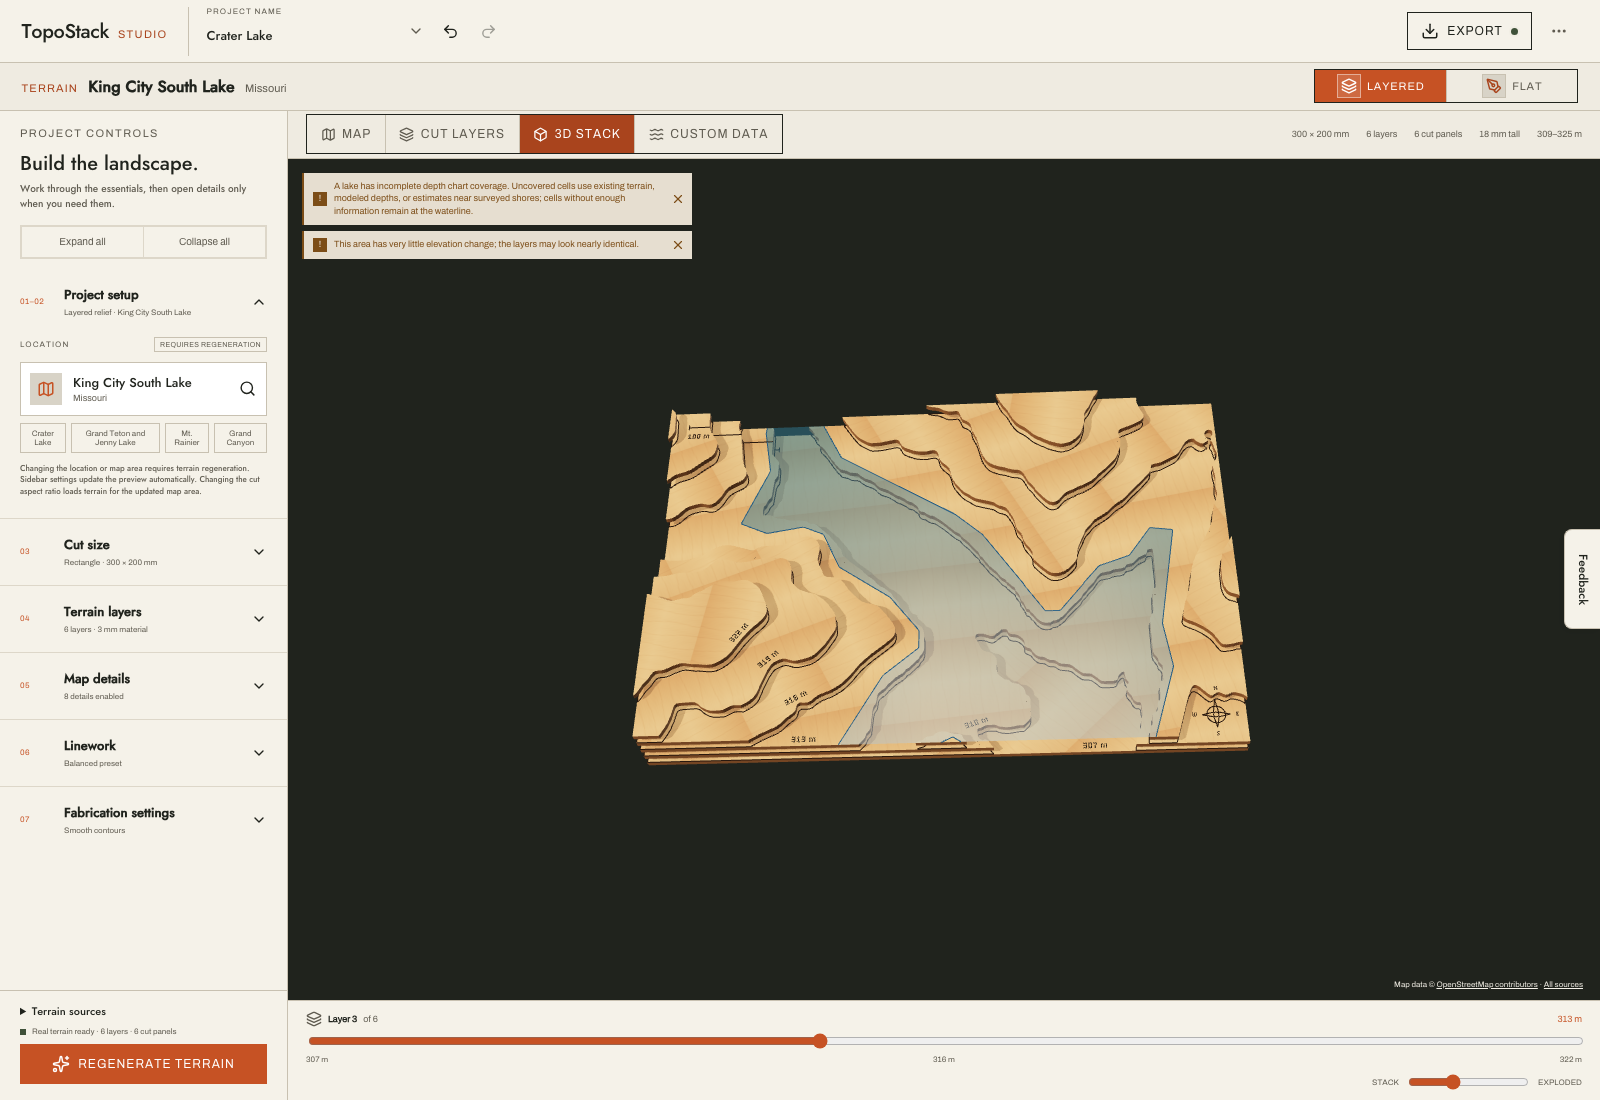
Where chart coverage is missing, existing terrain, modeled depths, or estimates near surveyed shores may fill the gap; cells without enough information remain at the waterline. Read coverage warnings and inspect those transitions. Stop using in the chart library restores the lake's other depth sources after regeneration.
Save unfinished work and move between computers
Export review draft saves editable contour work. Keep the original image or PDF separately: a draft does not contain it. After closing or reloading, upload that same file and page, then use Restore contour review draft. Recheck alignment, generate depths again, and repeat layer approval. Switching studio views preserves the in-progress draft; closing or reloading the page does not.
Kept charts live in this browser. Exported Project settings include the charts used by the project and their review status, so they can travel to another computer. Share links do not carry chart data. Original pictures are not included in kept charts or project exports.
Charts saved before contour review was introduced remain available for export and recovery, but cannot be applied to new generations. Recreate them from their original sources through the review workflow.
Before you cut
Review confirms that you checked the chart; it does not certify surveyed accuracy or physical cutability. Inspect the final cut layers, shoreline transitions, and small features. Test a representative cut and assembly with your material and kerf settings before committing the whole stack.
For the reasoning behind these steps, read how depth-chart tracing works. Continue with the custom lake depth map guide to finish the project.
Images: TopoStack using the public-domain USGS King City South chart. Map data © OpenStreetMap contributors. These are software validation captures, not photographs of a fabricated map.